Trend-following strategy with technical analysis and moving average
All known (programmable) roulette systems based on pure mathematics will not function in the long run, because with their few inflexible rules, they are structured as a template. Coincidence constantly produces new combinations of the distribution of opportunities, which simply do not fit into this symbolic template. If we disregard roulette wheel oriented approaches (cast range calculations, etc.) at this time and instead continue to experiment playfully with chance, we have only one possibility for optimization left – we have to adjust in a more flexible way for chance. At least we should try.
Intuitive players with a talent for acrobatic feats of memory can chart the course of the last set of roulette numbers from memory to certain visual patterns and draw conclusions for the further possible trend of certain roulette odds. Otherwise, the roulette player will draw more on self-drawn or computer-generated charts to adjust himself more flexibly to the Roulette trend.
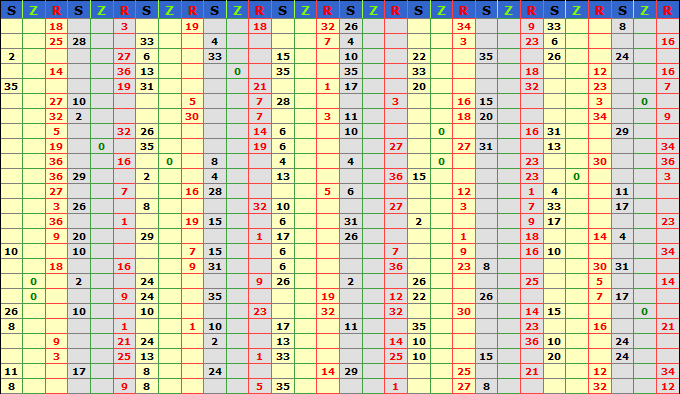
An example based on the permanence of the roulette numbers from Sunset Casino on March 1, 2011. It depicts the first 500 fallen roulette numbers of that day on table 1 (French roulette version), which were also published on the website of Sunset Casino.
The course of the black-and-red appearances will be displayed in the graph as a chart. After each black appearance the chart goes up by +1. Red in each case leads to -1 and there is no change with the zero, since the number is in the trend following determination irrelevant. For meaningful representation the imaginary zero line begins between the two simple chances black and red in the state of 100,so one does not have to calculate with negative numbers.
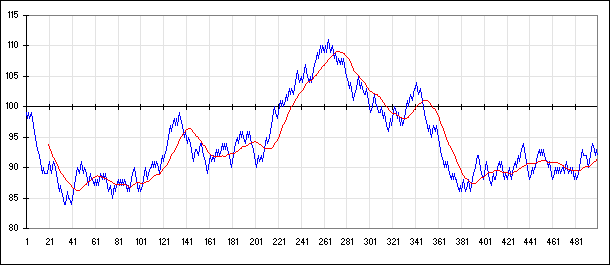
As an additional signal generator for trend changes, the moving average of the last 20 intermediate results is shown as a red line.
If the blue line on the black/red chart pushes above the red line, it could signal the start of a longer lasting blacktrend and one could accordingly reposition one’s simple chances. Conversely, the intersection in the lower direction corresponds to a signal transmitter for the red trend. In the example graph one can see that the trend adjustment would have in phases worked very well. But one can also see, that the adjustment with the moving average 20 indicator provides no useful results, when the chart moves in a narrow channel sideways. While these trends change without prolonged series on both sides or without significant break out of the sideways channel, the red line is crossed too often. In such phases one can bet progressively, as long as chances especially low volatility alternate with each other.
The chart example should initially serve only as food for thought. For example, you could significantly improved signaling by using the MACD indicator, which is used in stock charts and which combines several moving averages. Through the combination of shorter and longer moving averages false signals are filtered out.
Below the permanence of 1.3.2011, as published on the website of Sunset Casino.